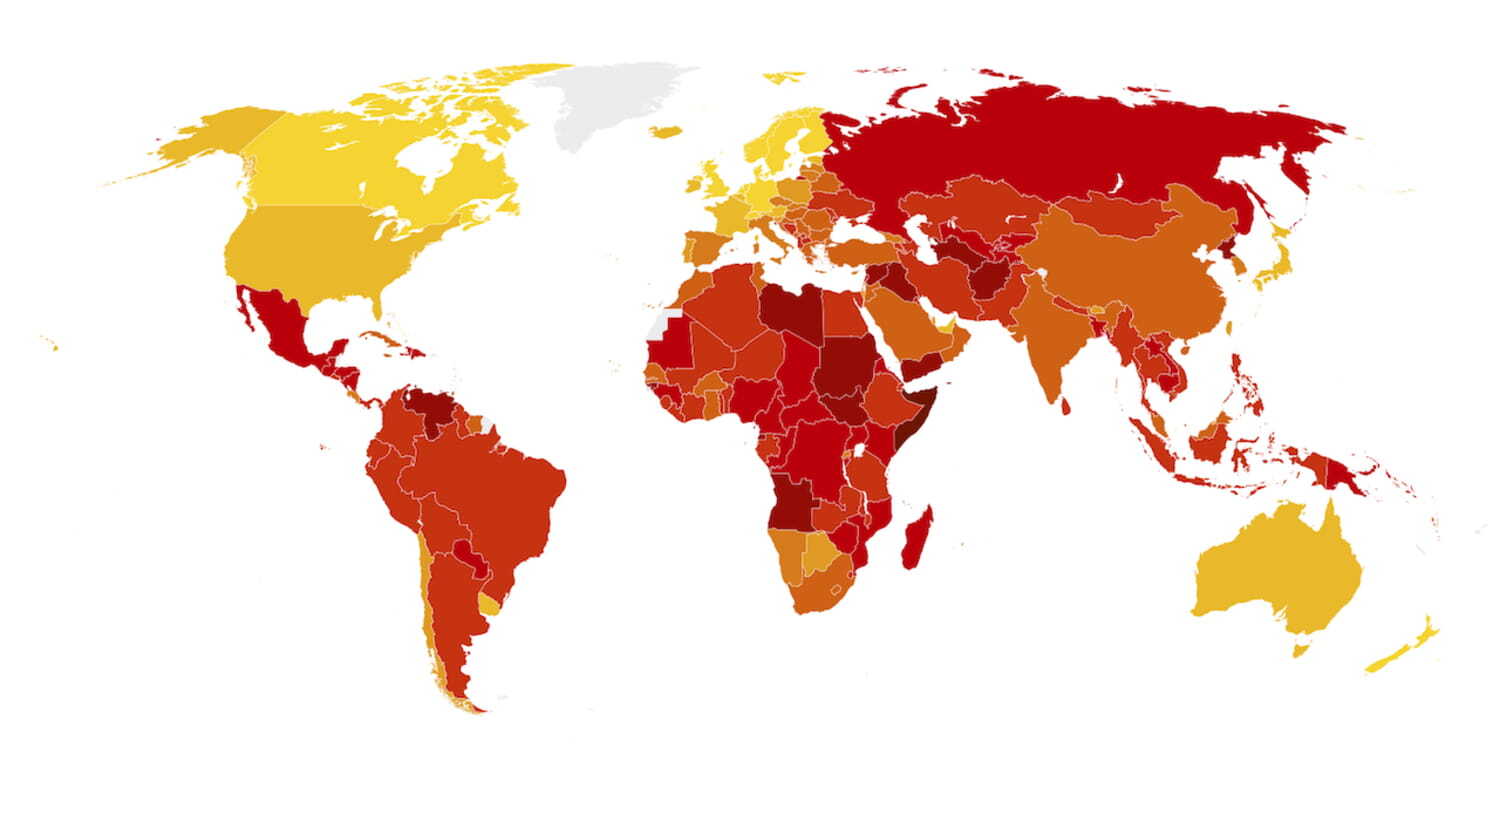
Transparency International Releases Corruption Perceptions Index 2018
CerebraTransparency International released the 2018 Corruption Perceptions Index (CPI). Denmark and New Zealand top the Index with 88 and 87 points, respectively. Somalia, South Sudan, and Syria are at the bottom of the index, with 10, 13 and 13 points, respectively.
Transparency International released the 2018 Corruption Perceptions Index (CPI). The study revealed that the continued failure of most countries to significantly control corruption is contributing to a crisis of democracy around the world. While there are exceptions, the data shows that despite some progress, most countries are failing to make serious inroads against corruption.
Since its inception in 1995, the Corruption Perceptions Index, Transparency International’s flagship research product, has become the leading global indicator of public sector corruption. The index offers an annual snapshot of the relative degree of corruption by ranking countries and territories from all over the globe. The 2018 CPI draws on 13 surveys and expert assessments to measure public sector corruption in 180 countries and territories, giving each a score from zero (highly corrupt) to 100 (very clean).
| Corruption is much more likely to flourish where democratic foundations are weak and, as we have seen in many countries, where undemocratic and populist politicians can use it to their advantage.
Delia Ferreira Rubio |
CPI Highlights
More than two-thirds of countries score below 50, with an average score of only 43. Since 2012, only 20 countries have significantly improved their scores, including Estonia and Côte D’Ivoire, and 16 have significantly declined, including Australia, Chile and Malta.
Denmark and New Zealand top the Index with 88 and 87 points, respectively. Somalia, South Sudan, and Syria are at the bottom of the index, with 10, 13 and 13 points, respectively. The highest scoring region is Western Europe and the European Union, with an average score of 66, while the lowest scoring regions are Sub-Saharan Africa (average score 32) and Eastern Europe and Central Asia (average score 35).
Corruption and the Crisis of Democracy
Cross analysis with global democracy data reveals a link between corruption and the health of democracies. Full democracies score an average of 75 on the CPI; flawed democracies score an average of 49; hybrid regimes – which show elements of autocratic tendencies – score 35; autocratic regimes perform worst, with an average score of just 30 on the CPI.
Exemplifying this trend, the CPI scores for Hungary and Turkey decreased by eight and nine points respectively over the last five years. At the same time, Turkey was downgraded from ‘partly free’ to ‘not free’, while Hungary registered its lowest score for political rights since the fall of communism in 1989. These ratings reflect the deterioration of rule of law and democratic institutions, as well as a rapidly shrinking space for civil society and independent media, in those countries.
More generally, countries with high levels of corruption can be dangerous places for political opponents. Practically all of the countries where political killings are ordered or condoned by the government are rated as highly corrupt on the CPI.
The Corruption Perceptions Index Methodology
The CPI scores and ranks countries/territories based on how corrupt a country’s public sector is perceived to be by experts and business executives. It is a composite index, a combination of 13 surveys and assessments of corruption, collected by a variety of reputable institutions. The CPI is the most widely used indicator of corruption worldwide. 13 data sources were used to construct the Corruption Perceptions Index (CPI) 2018:
1. African Development Bank Country Policy and Institutional Assessment 2016
2. Bertelsmann Stiftung Sustainable Governance Indicators 2018
3. Bertelsmann Stiftung Transformation Index 2017-2018
4. Economist Intelligence Unit Country Risk Service 2018
5. Freedom House Nations in Transit 2018
6. Global Insight Business Conditions and Risk Indicators 2017
7. IMD World Competitiveness Center World Competitiveness Yearbook Executive Opinion Survey 2018
8. Political and Economic Risk Consultancy Asian Intelligence 2018
9. The PRS Group International Country Risk Guide 2018
10. World Bank Country Policy and Institutional Assessment 2017
11. World Economic Forum Executive Opinion Survey 2018
12. World Justice Project Rule of Law Index Expert Survey 2017-2018
13. Varieties of Democracy (V-Dem) 2018

Source: Transparency International
https://www.transparency.org/cpi2018


